Lesson 7: Earned Value Analysis
- b00108386
- Nov 22, 2020
- 2 min read
Earned value analysis is a calculation that allows us to plan, monitor, and control all aspects related to the project performance like Time, Resources & Work specifications.
Proper planning and setting out a monitoring system is essential and can reduce the extent and cost of poor performance and time/cost overruns.
The earned value chart
A method that measures the overall performance of the project. This is done by putting the work performed and the actual cost in a chart with Y being the expenditures and the X-axis representing time. The variance between different charts will give us an in-depth analysis of the performance of the project so far.

1. BCWS: Assigned value or original budgeted cost of the item or known as well as the baseline budget.
Graphing BCWS
Calculate the total spend every couple of weeks depending on the project duration and record these numbers into a table and add these numbers for each weel which will give us the cumulative BCWS. These final numbers need to be plotted into a graph and it will look like something below.

2. BCWP: Also known as earned value, it is the total value credited to a project at a point in time.
Graphing BCWP: The earned value of a task is found by multiplying the estimated percent completion by the budgeted cost for the task. The result will be the amount that should have been spent so far. This should be done for every task in the project until the point that we have a table with the values which we will then use to make the graph.
Once we have both the BCWS & BCWP in a graph we can determine the schedule variance or how much we are behind schedule.

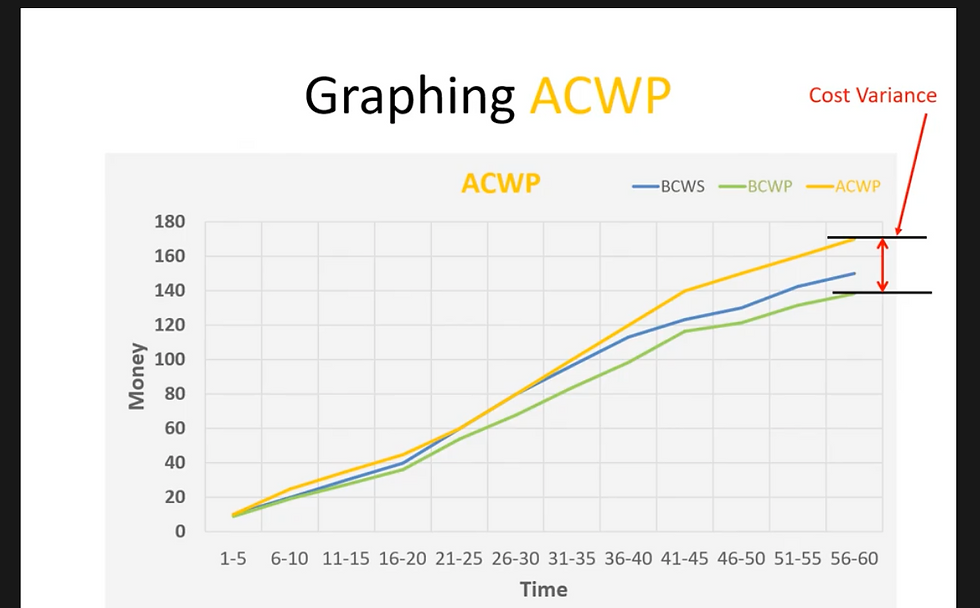
3. ACWP: How much has been spent to date. Comparing ACWP against BCWP allows to find out the cost variance (CV) - CV= BCWP - ACWP
If the number obtained during this formula is negative then it means that we have spent more than was anticipated.
4. ECAC: Known as the cost of work still performed to reach 100 % of completion. This depends of the PM's estimations.
ECAC= Project Budget - Cost Variance
This will allow us to then calculate the Cost of works still to be completed (CTC)
CTC= ECAC - ACWP
The CTC number should be greater than the estimated benefits and is an essential tool for decision making in the project.
5. Schedule Variance: It determines the budgeted cost of work scheduled and measures in cash terms how far has worked progressed.
SV= BCWP - BCWS

6. Earned Value Indices:
Cost Performance Index
CPI= BCWP / ACWP - If the number is less than 1 then it means that the value earned from money is less than expected
Schedule Permonace Index
SPI= BCWP / BCWS - If the number is less than 1 then it means that the progress is slower than planned
Time Performance Index
TPI= STWP / ATWP - An indication of how far we are behind planned time.
All these ratios are very useful for comparing the performances of several projects.


Hi Gregory, great looking post. The difference when including some images, graphs and charts to help explain concepts. The beauty of it all is that the software will do these calculations for us. MS Project really is a very powerful tool for managing and running projects of any size and I would recommend using the software even on the smallest of jobs starting off. It impresses the client, your co-workers and any subcontractors you are employing. Not to mention helps you stay ahead of the curve so to speak.
Thanks
Robbie